Polarography is an electrochemical method of analysis based on the measurement of the current flow resulting from the electrolysis of a solution at a polarizable microelectrode, as a function of an applied voltage. The polarogram (see Figure 1) obtained by this measurement provides qualitative and quantitative information on electro-reducible and electro-oxidizable substances. The normal concentration range for substances being analyzed is from 10 2 molar to 105 molar.
In direct current (dc) polarography, the microelectrode is a dropping mercury electrode (DME) consisting of small reproducible drops of mercury flowing from the orifice of a capillary tube connected to a mercury reservoir. A saturated calomel electrode (SCE) with a large surface area is the most commonly employed reference electrode. As the voltage applied to the cell increases, only a very small residual current flows until the substance under assay undergoes reduction or oxidation. Then the current increases, at first gradually, then almost linearly with voltage, and it gradually reaches a limiting value as is shown in Figure 1.
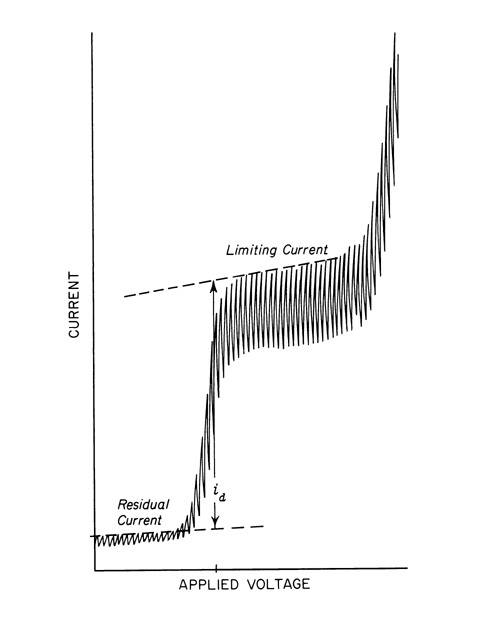
Fig. 1. Typical Polarogram Showing Change in Current Flow with Increasing Potential Applied to the Dropping Mercury Electrode.
On the initial rising portion of the polarographic wave, the increased flow of current results in a decrease in the concentration of the electro-active species at the electrode surface. As the voltage and current increase, the concentration of the reactive species decreases further to a minimal value at the electrode surface. The current is then limited by the rate at which the reacting species can diffuse from the bulk of the solution to the surface of the microelectrode. The final current rise is caused by the reaction of the supporting electrolyte. This large concentration of electrolyte is inert within the potential range used in the analysis, and it prevents the reactive species from reaching the electrode by electrical migration, thus assuring that the limiting current is diffusion-controlled.
Since, in the case of the DME, the electrode surface is being constantly renewed in a cyclic fashion, the current increases from a small value as the drop begins to form to a maximum value as the drop falls. By the use of a suitable recorder to measure the current, the characteristic saw-toothed record is obtained. The limiting current is the sum of the residual and the diffusion currents. The residual current is subtracted from the limiting current to give the wave height.
Ilkovic Equation— The linear relationship between the diffusion current (id) and the concentration of electro-active species is shown by the Ilkovic equation:
id = 708nD1 / 2Cm2 / 3t1 / 6
in which id is the maximum current in microamperes; n is the number of electrons required per molecule of electro-active substance; D is its diffusion coefficient, in square cm per second; C is the concentration, in millimoles per L; m is the rate of mercury flow from the DME, in mg per second; and t is the drop time, in seconds.
Modern polarographs are equipped with recorders capable of following the current during the latter portion of the drop life; consequently, the maximum of the oscillations is the measure of the current. When the current is measured only at the end of the drop life, the technique is termed sampled dc polarography. In this case, only the maximum currents are recorded and oscillations due to drop growth are not observed.
For instruments equipped with galvanometers to measure the current or recorders operated in a damped mode, the saw-toothed waves correspond to oscillations about the average current. In the latter case, the average of the oscillations is the measure of the current. For polarograms obtained in this manner, the id given by the Ilkovic equation is the average current in microamperes observed during the life of the drop, when the coefficient 708 is replaced by 607.
Control of the Diffusion Current— The Ilkovic equation identifies the variables that must be controlled to ensure that the diffusion current is directly proportional to the concentration of electro-active material. At 25
The capillary for the DME has a bore of approximately 0.04 mm and a length of 6 cm to 15 cm. The height of the mercury column, measured from the tip of the capillary to the top of the mercury pool, ranges from 40 cm to 80 cm. The exact length of the capillary and the height of the mercury column are adjusted to give a drop-time of between 3 and 5 seconds at open circuit with the capillary immersed in the test solution.
Equipment is available that allows controlled drop-times of fractions of a second to several seconds. As detail within a polarogram is related to the number of drops delivered during a given potential change, such short drop-times allow more rapid recording of the polarogram.
The current flowing through the test solution during the recording of a polarogram is in the microampere range. Thus, the current flow produces negligible changes in the test solution and several polarograms can be run on the same test solution without significant differences.
Half-wave Potential— The half-wave potential (E1/2) occurs at the point on the polarogram one-half the distance between the residual current and the limiting current plateau. This potential is characteristic of the electro-active species and is largely independent of its concentration or the capillary used to obtain the wave. It is dependent upon the solution composition and may change with variations in the pH or in the solvent system or with the addition of complexing agents. The half-wave potential thus serves as a criterion for the qualitative identification of a substance.
The potential of the DME is equal to the applied voltage versus the reference electrode after correction for the iR drop (that potential need to pass the current, i, through the solution with a resistance R). It is especially important to make this correction for nonaqueous solutions, which ordinarily possess high resistance, if an accurate potential for the DME is needed. Correction of the half-wave potential is not required for quantitative analysis. Unless otherwise indicated, it is to be understood that potentials represent measurements made against the SCE.
Removal of Dissolved Oxygen— Inasmuch as oxygen is reduced at the DME in two steps, first to hydrogen peroxide and then to water, it interferes where polarograms are to be made at potentials more negative than about 0 volt versus SCE, and must be removed. This may be accomplished by bubbling oxygen-free nitrogen through the solution for 10 to 15 minutes immediately before recording the wave, the nitrogen first having been “conditioned” to minimize changes due to evaporation, by being passed through a separate portion of the solution.
It is necessary that the solution be quiet and vibration-free during the time the wave is recorded, to ensure that the current is diffusion-controlled. Therefore, the nitrogen aeration should be stopped and the gas be directed to flow over the surface of the solution before a polarogram is recorded.
In alkaline media, sodium bisulfite may be added to remove oxygen, provided the reagent does not react with other components of the system.
Measurement of Wave Height— To use a polarogram quantitatively, it is necessary to measure the height of the wave. Since this is a measure of the magnitude of the diffusion current, it is measured vertically. To compensate for the residual current, the segment of the curve preceding the wave is extrapolated beyond the rise in the wave. For a well-formed wave where this extrapolation parallels the limiting current plateau, the measurement is unambiguous. For less well-defined waves, the following procedure may be used unless otherwise directed in the individual monograph. Both the residual current and the limiting current are extrapolated with straight lines, as shown by the graph (Figure 1). The wave height is taken as the vertical distance between these lines measured at the half-wave potential.
Procedure— [Caution—Mercury vapor is poisonous, and metallic mercury has a significant vapor pressure at room temperature. The work area in which mercury is used should be constructed in such a way that any spilled or spattered droplets of mercury can be completely recovered with relative ease. Scrupulously clean up mercury after each use of the instrument. Work in a well-ventilated laboratory, taking care to clean up any spilled mercury. ] Transfer a portion of the final dilution of the substance being assayed to a suitable polarographic cell immersed in a water bath regulated to 25 ± 0.5
Pulse Polarography— In conventional dc polarography, the current is measured continuously as potential is applied as a linear ramp (see Figure 2).
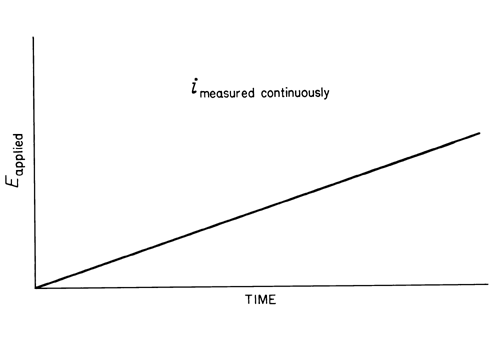
Fig. 2. Direct Current (dc) Polarography.
In normal pulse polarography, a potential pulse is applied to the mercury electrode near the end of the drop life, with the drop being held at the initial potential during growth period (see Figure 3).
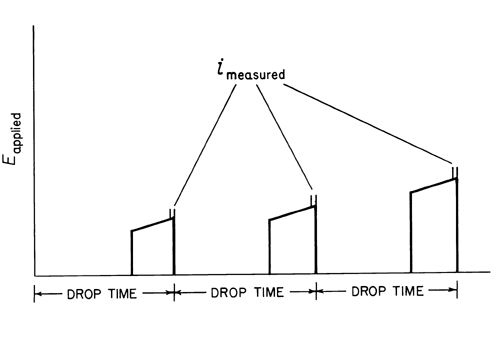
Fig. 3. Pulse Polarography.
Each succeeding drop has a slightly higher pulse applied to it, with the rate of increase being determined by the selected scan rate. The current is measured at the end of the pulse where the capacitative current is nearly zero, and thus primarily faradaic current is measured (see Figure 4).
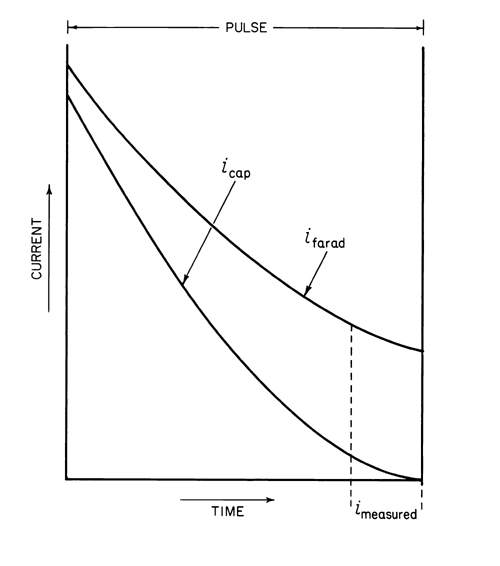
Fig. 4. Plot of Current Versus Time in Pulse Polarography.
In addition, since the pulse is applied for only a short duration, the diffusion layer is not depleted as extensively as in dc polarography and larger current levels are obtained for equivalent concentrations. Concentrations as low as 106 M can be measured, providing approximately a ten-fold increase in sensitivity over that with dc polarography. Limiting current values are more easily measured, since the waves are free from oscillations.
Differential pulse polarography is a technique whereby a fixed-height pulse applied at the end of the life of each drop is superimposed on a linear increasing dc ramp (see Figure 5).
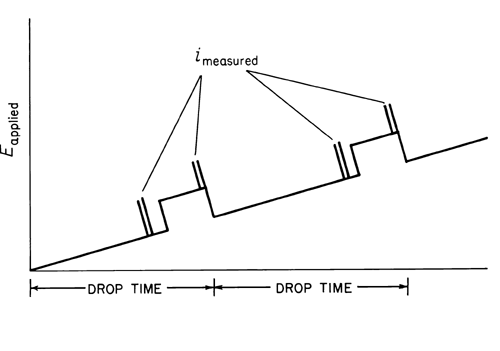
Fig. 5. Differential Pulse Polarography.
Current flow is measured just before application of the pulse and again at the end of the pulse. The difference between these two currents is measured and presented to the recorder. Such a differential signal provides a curve approximating the derivative of the polarographic wave, and gives a peak presentation. The peak potential is equivalent to:
E1 / 2 – DE / 2
where DE is the pulse height. The peak height is directly proportional to concentration at constant scan rates and constant pulse heights. This technique is especially sensitive (levels of 107M may be determined) and affords improved resolution between closely spaced waves.
Anodic Stripping Voltammetry— Anodic stripping voltammetry is an electrochemical technique whereby trace amounts of substances in solution are concentrated (reduced) onto an electrode and then stripped (oxidized) back into solution by scanning the applied voltage anodically. The measurement of the current flow as a function of this voltage and scanning rate provides qualitative and quantitative information on such substances. The concentration step permits analyses at 10
Basic instrumentation includes a voltage ramp generator; current-measuring circuitry; a cell with working, reference, and counter electrodes; and a recorder or other read-out device. Instruments having dc or pulse-polarographic capabilities are generally quite adequate for stripping application. The working electrode commonly used is the hanging mercury drop electrode (HMDE), although the mercury thin-film electrode (MTFE) has acquired acceptance. For analysis of metals such as silver, platinum, and gold, whose oxidation potentials are more positive than mercury, and mercury itself, the use of solid electrodes such as platinum, gold, or carbon is required. A saturated calomel electrode or a silver–silver chloride electrode serves as the reference except for the analysis of mercury or silver. A platinum wire is commonly employed as the counter electrode.
Test specimens containing suitable electrolyte are pipeted into the cell. Dissolved oxygen is removed by bubbling nitrogen through the cell for 5 to 10 minutes.
Generally, an electrolysis potential equivalent to 200 to 300 mV more negative than the half-wave potential of the material to be analyzed is applied (although this potential is to be determined experimentally), with stirring for 1 to 10 minutes. For reproducible results, maintain constant conditions (i.e., deposition time, stirring rate, temperature, specimen volume, and drop size if HMDE is used).
After deposition, the stirring is discontinued and the solution and electrode are allowed to equilibrate for a short period. The potential is then rapidly scanned anodically (10 mV/second or greater in dc polarography and 5 mV/second in differential pulse polarography). As in polarography, the limiting current is proportional to concentration of the species (wave height in dc and pulse; peak height in differential pulse), while the half-wave potential (dc, pulse) or peak potential (differential pulse) identifies the species. It is imperative that the choice of supporting electrolyte be made carefully in order to obtain satisfactory behavior. Quantitation is usually achieved by a standard addition or calibration method.
This technique is appropriate for trace-metal analysis, but has limited use in organic determinations, since many of these reactions are irreversible. In analyzing substances such as chloride, cathodic stripping voltammetry may be used. The technique is the same as anodic stripping voltammetry, except that the substance is deposited anodically and then stripped by a cathodic voltage scan.
Auxiliary Information— Please check for your question in the FAQs before contacting USP.
| Topic/Question | Contact | Expert Committee |
| General Chapter | Antonio Hernandez-Cardoso, B.S.
Scientist, Latin American Specialist 1-301-816-8308 |
(GC05) General Chapters 05 |
USP32–NF27 Page 355